


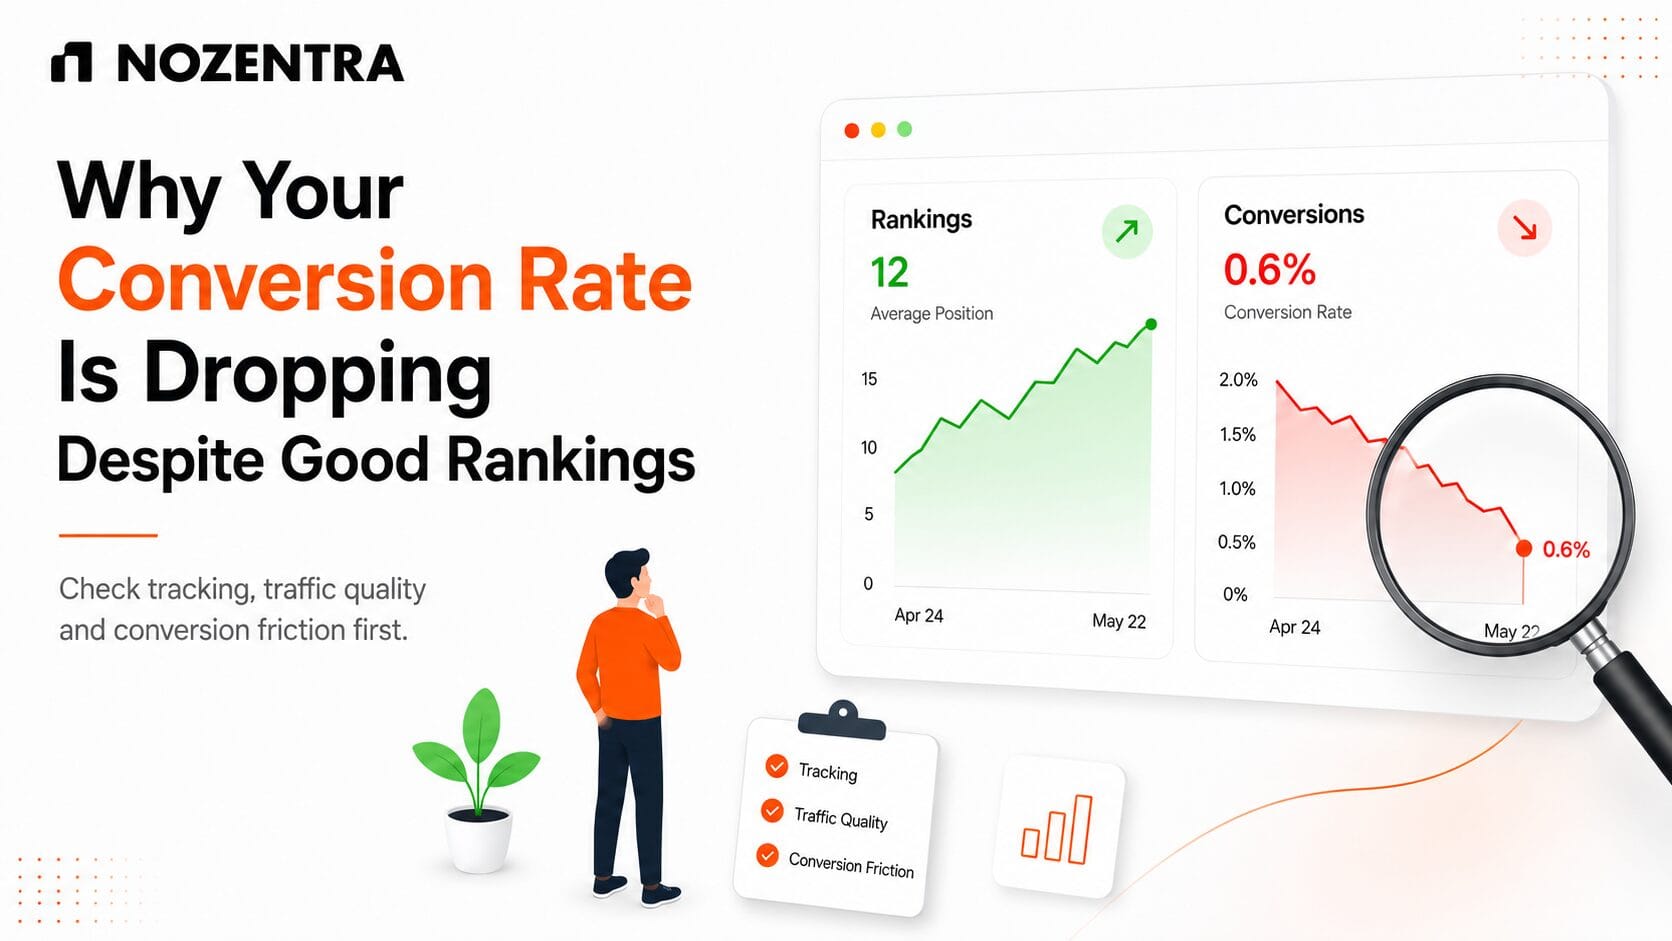
A falling conversion rate alongside stable rankings can have several causes, often more than one at once. Check tracking, the conversion process, traffic quality and off-page changes before assuming it’s the page.
Key takeaways
- Define “conversion” and how it’s calculated, by session or by user, before diagnosing a drop.
- Causes include broken tracking, a failed process, a traffic shift, an offer change, or the page itself. They often overlap.
- Rankings, impressions and click-through rate are a separate diagnosis, not covered here.
- ICE (impact, confidence, ease) helps prioritise tests. It doesn’t guarantee a revenue outcome.
Where to look, and why
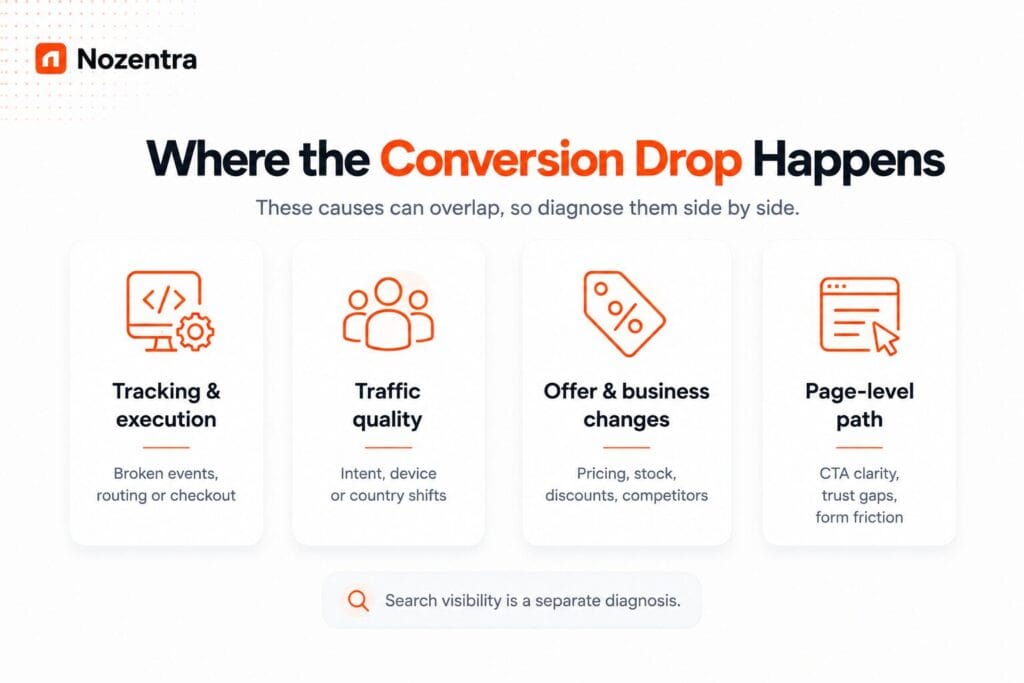
| Area | What to check | Note |
|---|---|---|
| Tracking & execution | Tags, consent, payment, booking and lead-routing failures | Mix of quick and deep checks |
| Traffic quality | Intent, device, country, new vs returning, referral | Can coexist with others |
| Offer & business changes | Pricing, stock, policy, competitor offers | Can coexist with others |
| Search visibility | Rankings, impressions, CTR by segment | Separate diagnosis |
| Page-level conversion path | Intent match, CTAs, trust signals, form friction | One cause among several |
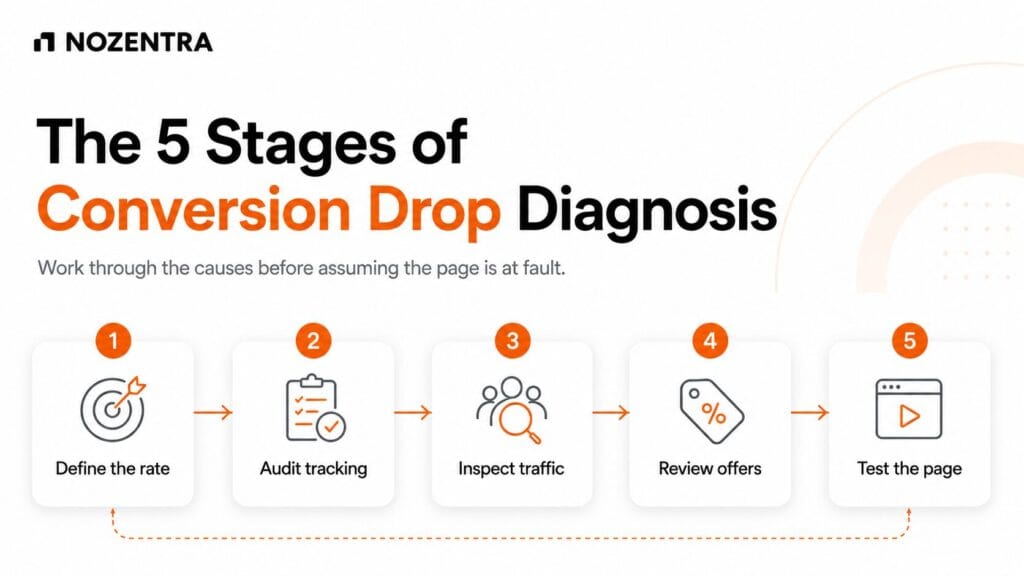
Define the conversion and the formula first
“Conversion” needs a specific definition: a form, call, signup, booking, purchase, or qualified lead. A drop in one doesn’t automatically mean a drop in business results.
- Session conversion rate: (sessions with at least one conversion ÷ total sessions) × 100
- User conversion rate: (users with at least one conversion ÷ total users) × 100
- A session with three conversion events still counts once toward session rate; a user converting across two visits still counts once toward user rate
- Confirm which version you’re comparing, and check revenue per visitor and lead quality too, since a falling rate can coincide with rising revenue
Rule out tracking and execution failures
A measurement gap or broken process step can look identical to a real drop. Some checks are quick; consent and integrations often need closer investigation.
- GA4 events that stopped firing after a site or tag manager change
- Consent mode: Basic blocks tags until a decision is made, so nothing reaches Google meanwhile. Advanced loads tags immediately and sends cookieless pings while consent is denied, supporting Google’s conversion modelling if set up correctly and eligible; treat modelled data as an estimate, not a count
- Payment declines, booking errors, or lead-routing failures that stop a submission being recorded, separate from later metrics like follow-up speed or deal outcome
- Cross-domain or ecommerce tracking breaking after a checkout or platform update
If any of these are active, fix the process, not the page.
Check whether the traffic itself has changed
- Query intent mix, device and country, new versus returning visitors, and branded traffic
- GA4’s AI-assistant classification is still changing and reported inconsistently, so check Google’s current documentation rather than a fixed list
- AI-referred traffic without a referrer can land as Direct, but there’s no reliable way to know how often
- Direct also has other causes, including bookmarks, typed URLs, stripped parameters, redirects and privacy tools, so a change in Direct alone isn’t reliable evidence of anything specific
- Bot and spam traffic are worth ruling out
Check what changed outside the page
Pricing, shipping costs, stock, an ending discount, a competitor’s offer, a policy change, or a demand shift can affect conversions without the page changing.
Check whether this is a search visibility problem
If rankings, impressions or CTR shifted in a specific segment while the average looks flat, that’s a separate diagnosis. A stable average can hide declines in specific keywords, branded search, one device, country or page, and this can happen alongside the causes above, not instead of them.
Page-level conversion problems
One possible cause among the others, and can occur alongside them:
- Intent mismatch: the page attracts a question it doesn’t clearly answer up front
- Unclear next step: competing CTAs, or none that stand out
- Trust gaps: no visible proof, credentials, or pricing clarity at the decision point
- Form friction: more fields or steps than earned at this stage
Quantitative data shows where; qualitative input, such as session recordings or user research, usually explains why.
Prioritising what to test
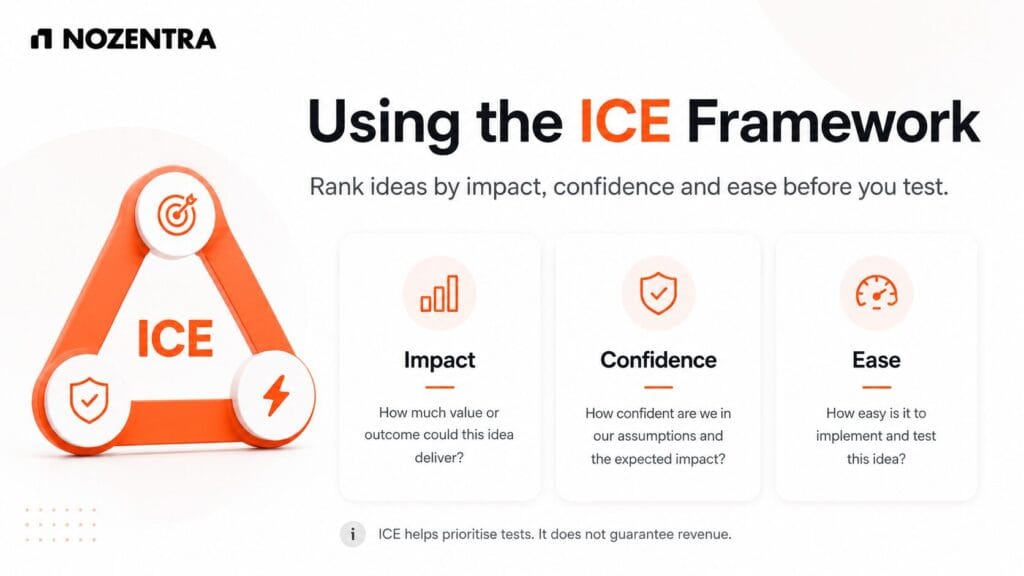
ICE scores each idea roughly 1 to 10 on impact, confidence (real evidence, not opinion), and ease, then combines them to rank ideas. It helps decide what to test first, not guarantee a test will improve revenue.
Next step
Work through tracking, execution, traffic quality and offer changes, check search visibility separately, and size page-level testing to traffic and baseline rate, not a fixed schedule. More than one cause is often present together, so treat these as parallel checks, not a fixed order.
Not sure which applies? Nozentra can run a diagnostic review covering all of it.
FAQs
How is this different from a full CRO audit?
This is the diagnostic step before one. It depends on the site, data and traffic: session recordings, user research, or A/B testing where traffic supports it, not fixed stages.
How long should a test run before I trust the result?
Long enough to reach enough conversions per variant for your baseline rate and the size of change tested, so the result isn’t random variation. A sample-size calculator using your own baseline beats a fixed rule like “two weeks.”
Can conversion rate fall while the business is doing fine?
Yes. If revenue per visitor, average order value, or lead quality rise at the same time, a lower rate can coexist with better results. Check it alongside a value-based metric before treating a drop as bad news.