A good website conversion rate is one that meets your business goal and holds up against a comparable group of sites or visitors. For a store measuring purchases per session, Littledata reported a 1.3% median across 438 Shopify stores in its November 2026 benchmark. A quote request, a free signup and a purchase each need their own yardstick. Start by checking that the action is recorded correctly, then compare the rate by channel and device before deciding what to improve. Littledata’s 2026 ecommerce benchmark
What is a good website conversion rate?
A good rate depends on what counts as a conversion, who arrives and how much a completed action is worth. A 2% purchase rate can be above the median in one category and below it in another. Use external figures to put your rate in context, then set a target against your own baseline and the value of the outcomes.
What do the 2026 benchmarks measure?
The average website conversion rate depends on the sample and how the publisher calculates it. Compare the measurement alongside the figure.
| 2026 source | Reported rates | What the comparison covers |
|---|---|---|
| Littledata Shopify benchmark | 1.3% median across 438 stores. Fashion and apparel was 1.0%, and beauty and skincare was 2.6%. | Share of sessions with at least one purchase. The sample covers participating Shopify stores from 3 August to 31 October 2026. |
| Contentsquare Digital Experience Benchmarks | 2.8% for paid search and 0.7% for organic social in the benchmark sample. | Channel-level results across industries in a report comparing Q4 2024 with Q4 2025. |
Littledata ranks stores using their GA4 purchase session rates. Its eligibility rules include minimum traffic and purchase counts, so the median describes a selected cohort. Contentsquare’s channel figures come from a different dataset and mix of websites. Read the definitions and sample boundaries in Littledata’s ecommerce conversion rate benchmark and Contentsquare’s 2026 conversion benchmarks.
When you set a target, match the action, denominator, industry and date range. Then compare like-for-like channels, devices and markets. For example, compare the mobile purchase rate for email traffic with the same segment last month. If you run a service website, follow completed enquiries through to qualified leads. A higher form completion rate has limited value when the sales team receives fewer suitable enquiries.
How do I calculate my conversion rate?
Divide the number of sessions with at least one completed conversion by the total sessions in the same period and segment. Multiply by 100 to get a session conversion rate.
Session conversion rate = (sessions with the selected action ÷ all sessions) × 100.
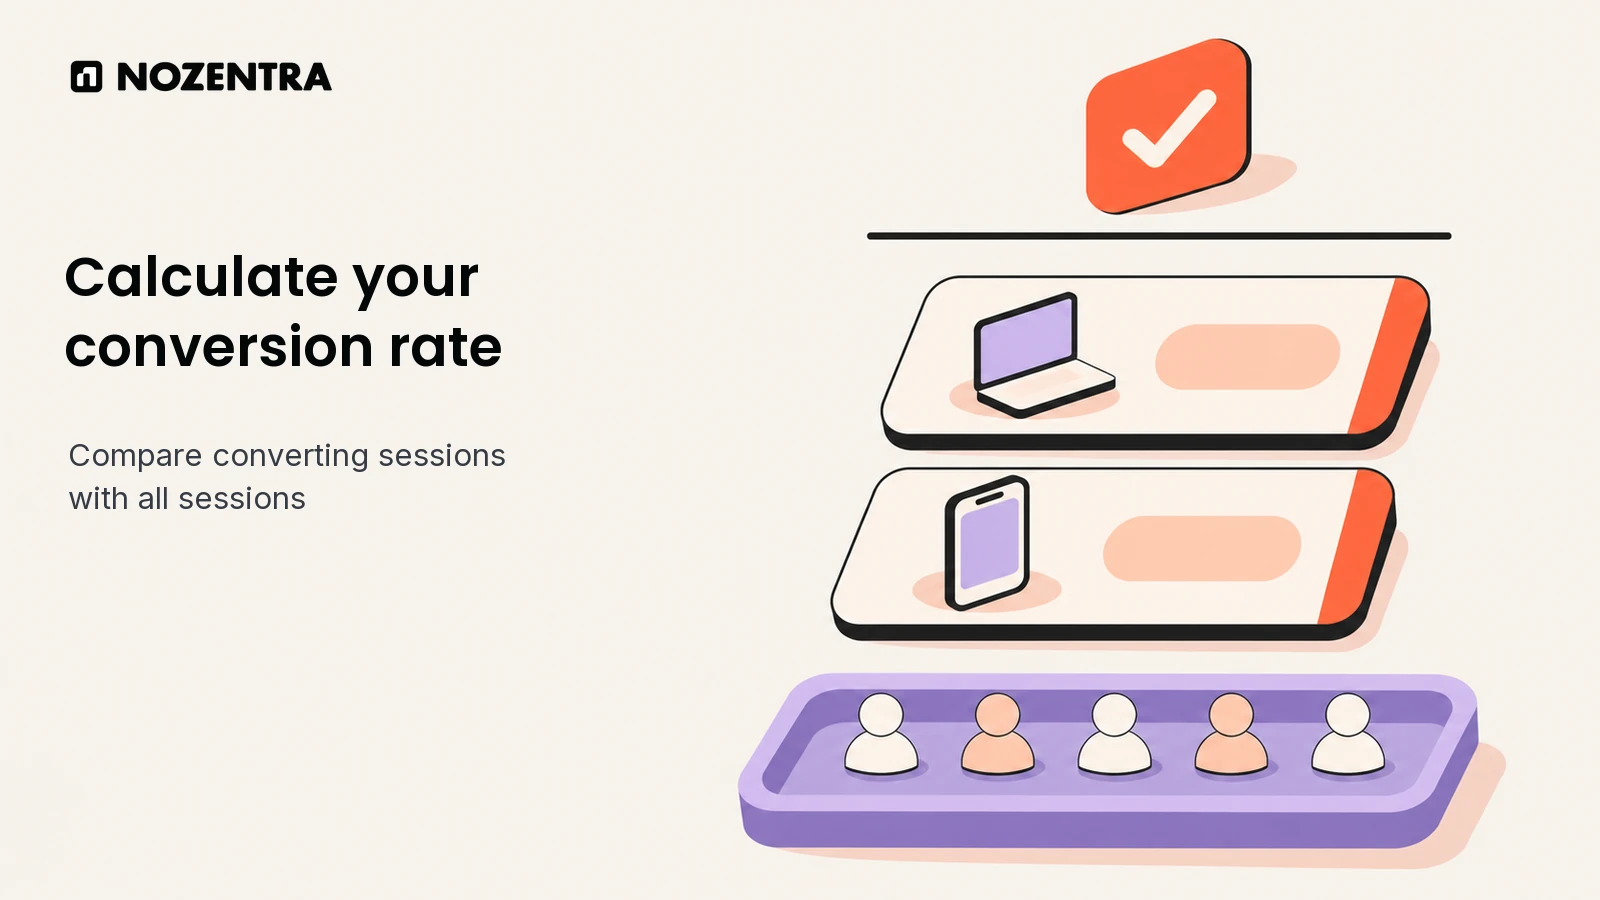
Suppose an online store records 2,000 sessions in a month. In 40 sessions, a customer completes at least one purchase. Divide 40 by 2,000 and multiply by 100. The purchase session conversion rate is 2%. If those sessions contain 44 orders, the store has 2.2 orders per 100 sessions. That measures order frequency. Each session still contributes at most once to the 2% session rate.
To measure the share of people who convert, divide users who completed the action by all users in the same report. Someone can visit three times before buying, so the user rate and session rate can differ. Record the action, denominator, date range and filters alongside your result so you can calculate it the same way next time. Google’s definition of session key event rate
Why is my website conversion rate low?
Start by checking whether people can complete the action and whether analytics records it. If those checks pass, compare the traffic mix, the offer and the steps where visitors drop off. A missed purchase event and a broken checkout can look similar in a report.
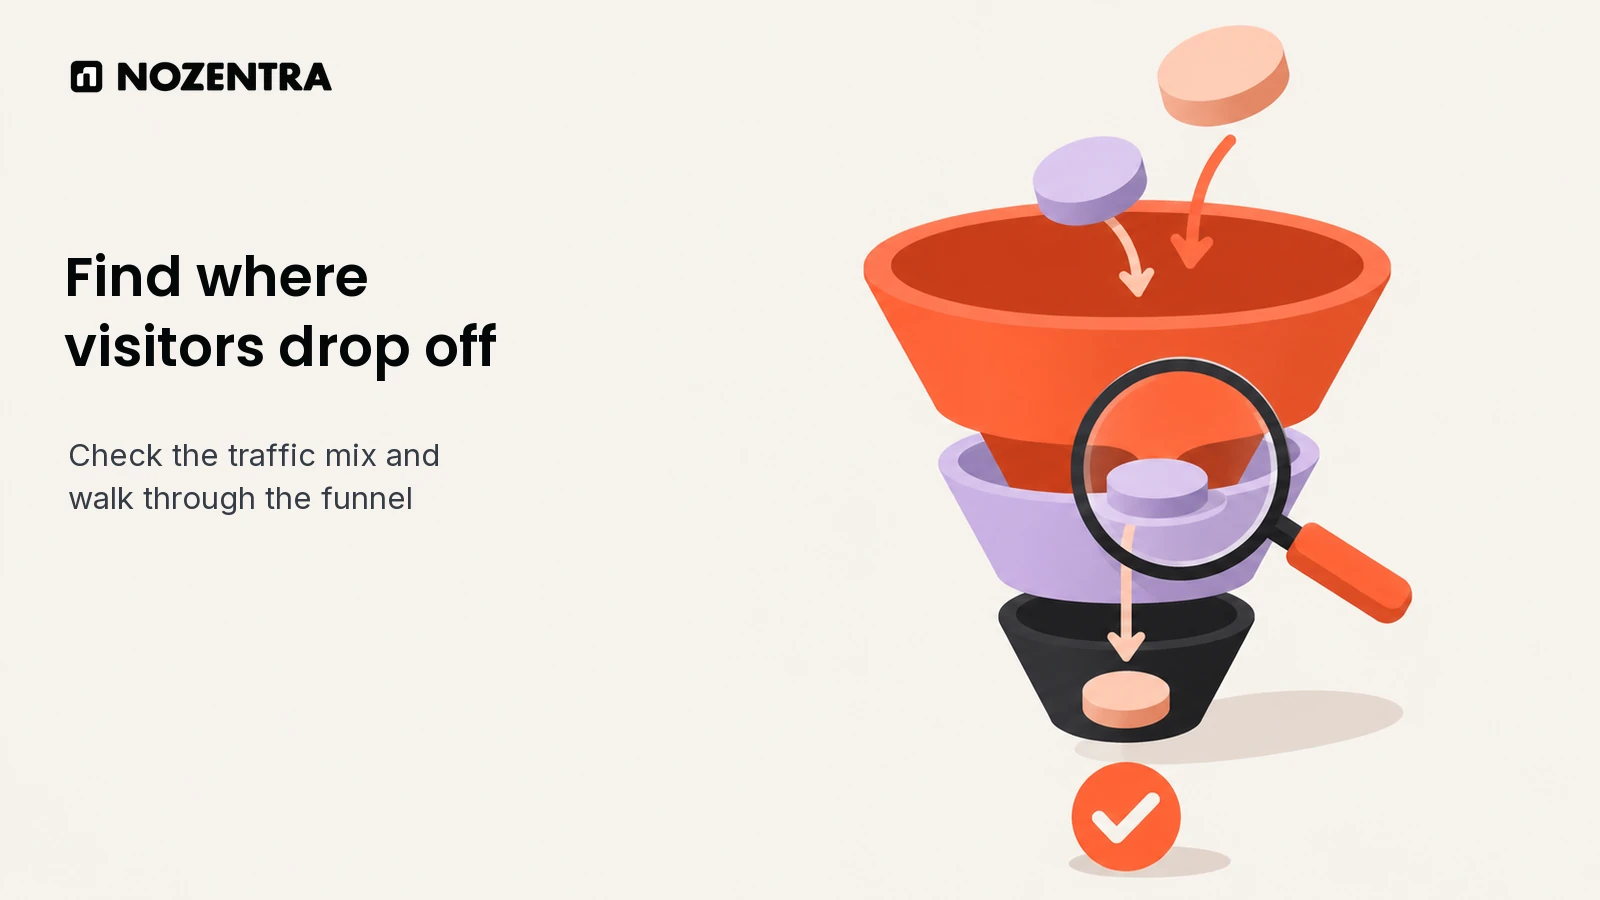
Check the transaction or enquiry against its source. Compare tracked purchases with order records or successful enquiries with the records that reach your sales team. Walk through the journey on mobile. Check whether a consent change, site release or checkout redirect coincides with the drop.
Split the rate by traffic source, device and landing page. Look at sessions and completed actions together. A new awareness campaign may bring visitors with different goals from people arriving through a product email. Compare the same segment across comparable periods before blaming a page.
Follow the path to completion. For a store, compare product views, cart adds, checkout starts and purchases. For a service site, check the journey from the service page to a confirmed form submission or booking. Try the step yourself and look for unclear shipping costs, slow delivery options, payment errors or a form that loses entries after an error. Baymard’s checkout usability research
Check what changed in the offer. Price, stock, delivery times and lead qualification rules can change the result while the page stays the same. Compare revenue or qualified enquiries alongside conversion rate before judging the impact.
We checked a two-channel example with illustrative numbers. In week one, 32 of 800 email sessions converted and 2 of 200 paid social sessions converted. In week two, 16 of 400 email sessions converted and 6 of 600 paid social sessions converted. Email stayed at 4% and paid social stayed at 1%, yet the overall rate fell from 3.4% to 2.2%. Paid social made up more of the traffic. Check for that shift before assuming either channel needs a redesign.
If search visibility looks stable, work through the diagnostic guide for falling conversions despite steady rankings. For a store, use the ecommerce website features guide to review the path from product discovery to payment.
What is conversion rate optimisation (CRO)?
Conversion rate optimisation is the process of finding what prevents visitors from completing an important action, changing one part of the experience and measuring the result. The work starts with a reliable measure and a problem you can observe.
How can I improve my website conversion rate?
Choose the first change based on where visitors struggle. If mobile shoppers reach checkout but cannot see delivery charges until late in the process, test showing the cost earlier. If people start an enquiry and fail on an unclear field, improve the field label and error message, then check successful submissions.
Choose a primary outcome and a safeguard. For a checkout change, measure sessions with a purchase and watch revenue per session and refunds. For a form change, measure successful enquiries and watch the share that meets your qualification criteria.
Fix confirmed faults before comparing designs. Repair a broken payment option or form first, and verify that the fix works. For a change with an uncertain effect, use a randomised A/B test when traffic supports it. Choose the outcome, smallest worthwhile change, sample size and stopping rule before you start.
Work with the evidence you have. With low traffic, watch people attempt the task, review error reports and compare results over a longer period. A before-and-after change can guide the next investigation, especially if you note changes in promotions and traffic mix.
Nozentra’s conversion rate optimisation and analytics service starts by agreeing on the conversion action, checking the available evidence and identifying a focused improvement to assess.
How do I track conversions in Google Analytics 4?
Set up a GA4 event that fires when the action succeeds, mark it as a key event where needed, and verify that it arrives before you use it in a report. Track purchases and enquiries separately so each rate answers a clear question.
Record the success event. Send
purchaseafter the order is confirmed orgenerate_leadwhen the form is successfully submitted. A button click can help diagnose the funnel. For purchase tracking on the web, use a unique, non-emptytransaction_idper order so GA4 can deduplicate repeat purchase events. Keep names, emails and other identifying details out of event parameters. Google’s transaction ID guidanceCheck whether it is a key event. GA4 marks
purchaseby default. For an existing lead event, open Admin → Data display → Events, find it in Recent events and select its star. Marking an event applies going forward. Google says to allow up to 24 hours for a newly marked event to appear in standard reports. Google’s instructions for marking key eventsTest the working and failing paths. With debug mode enabled, complete a test purchase or form submission and look for the right event in DebugView. Try an invalid submission to check that it leaves the success event unfired. For a purchase, reload the confirmation page and check that any repeat event uses the same transaction ID. Google’s DebugView instructions
Read the rate for the outcome you chose. Open Reports → Acquisition → Traffic acquisition. Find Session key event rate and select the relevant event in its dropdown. Read the rate next to sessions and key events for the same date range. Compare by session source or channel when you want to know which visits ended in a conversion. If your report has been customised, an editor can add the metric. Google’s Traffic acquisition report guide
A GA4 key event measures an important action in Analytics. A linked Google Ads account can use a GA4 key event to create a conversion for ad reporting and bidding. For website comparisons, use the GA4 session rate for the specific event you chose and keep the same denominator across reporting periods. Google’s explanation of key events and Ads conversions