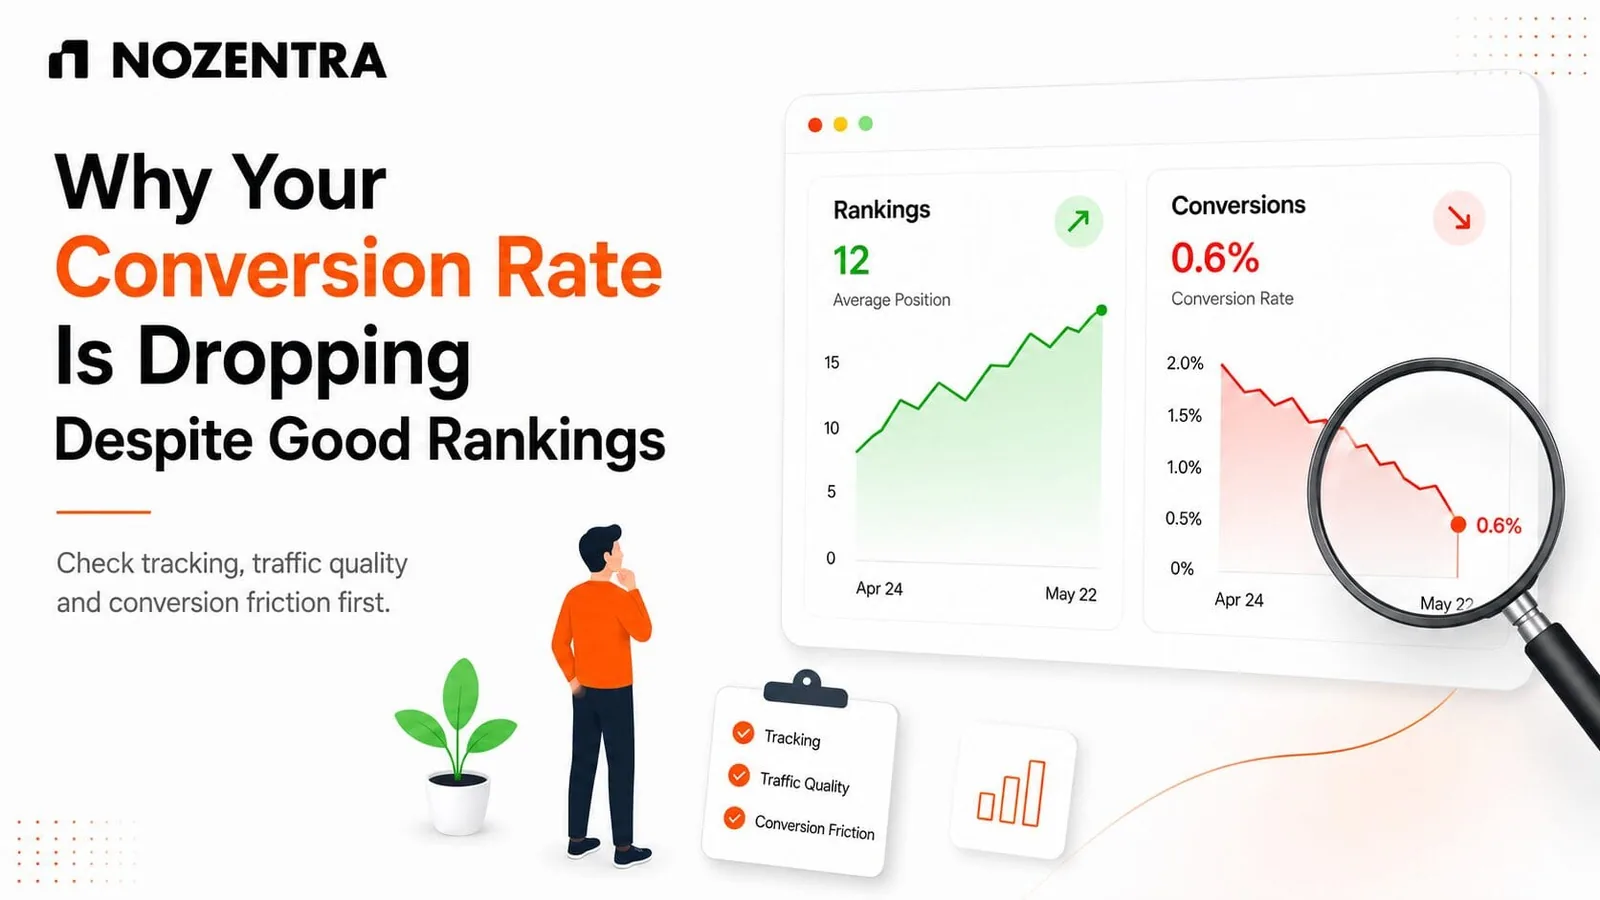
Rankings are flat. Traffic looks normal. Conversions are down, and nobody can say why.
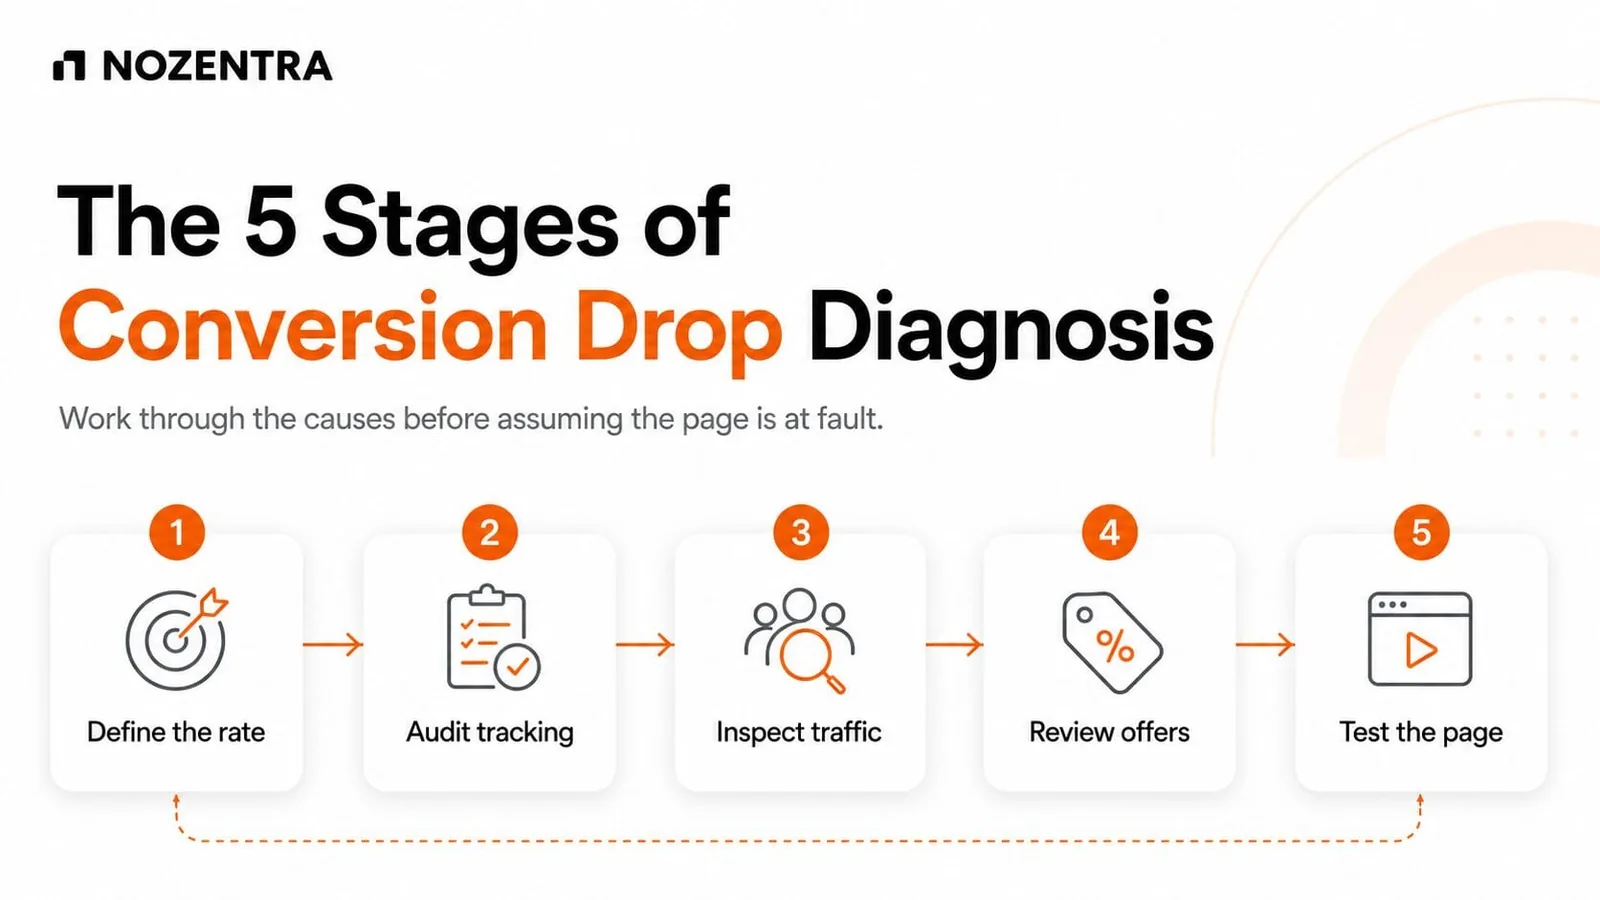
The instinct is to redesign the page. Usually the page is fine. Something upstream broke, and a broken conversion looks exactly like a bad conversion in a dashboard. This is the order we work through it, fastest and most likely causes first.
Key takeaways
Define the rate first. Session rate and user rate can tell different stories about the same traffic.
Rule out broken tracking and a broken process before testing anything on the page.
Check who is arriving. Same volume with a different intent mix will move the rate.
Ask what changed commercially. Price, shipping, stock and competitor offers move conversions without touching the site.
Size tests to your traffic. At a 3% baseline you need about 13,900 visitors per variant to trust a 20% lift.
Where should you look first?
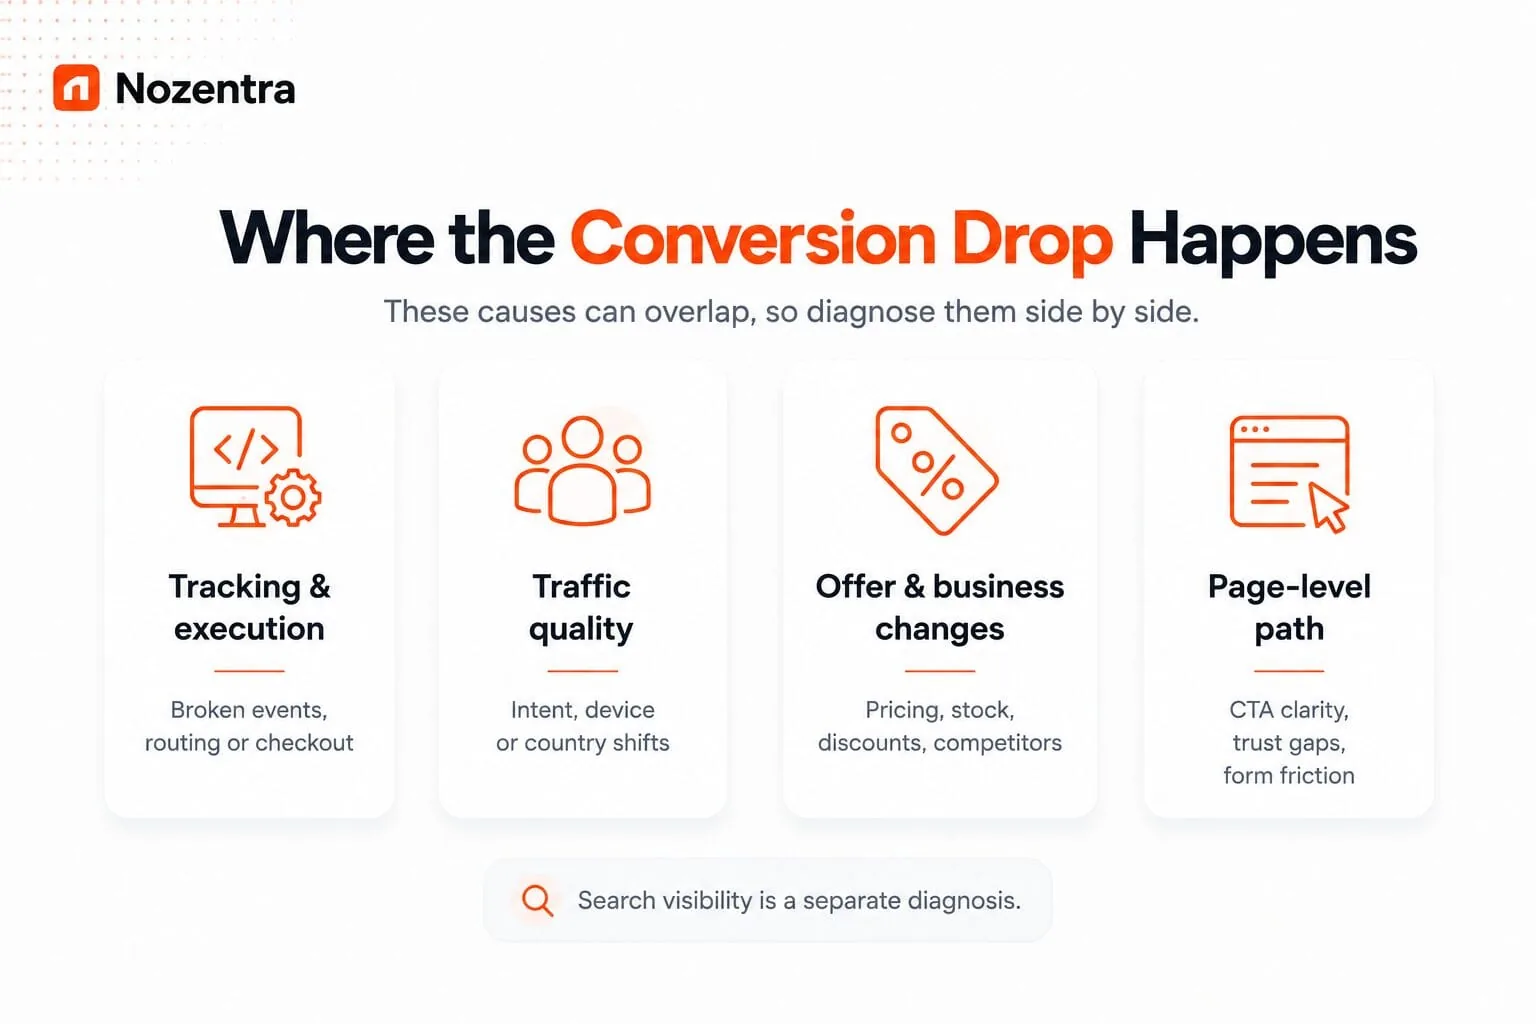
Most drops come from one of five areas, and they often overlap. Treat them as parallel checks, not a strict sequence.
| Area | What to check | How fast to check |
|---|---|---|
| Tracking and execution | Tags, consent mode, payments, booking and lead routing | Minutes to days |
| Traffic quality | Intent mix, device, country, new vs returning, bots | Under an hour |
| Offer and business changes | Pricing, shipping, stock, discounts, competitor offers | One conversation |
| Search visibility | Rankings, impressions and CTR by segment | Separate diagnosis |
| Page conversion path | Intent match, calls to action, trust, form friction | Weeks of testing |
Are you even comparing the same rate?
This takes ninety seconds and can invalidate everything after it.
Session conversion rate = sessions with at least one conversion / all sessions x 100
User conversion rate    = users with at least one conversion / all users x 100
Here is the same illustrative week measured both ways:
| Measure | Sessions view | Users view |
|---|---|---|
| Total | 1,000 sessions | 800 users |
| Converted at least once | 40 sessions | 38 users |
| Conversion rate | 4.0% | 4.75% |
If one report uses sessions and another uses users, you can manufacture a "drop" without anything changing on the site.
Then check the number that decides whether you have a problem at all: revenue per visitor, or lead quality if you sell services. A rate can fall while revenue per visitor rises, which is what happens when fewer but better qualified buyers arrive. That is a mix change, not a conversion problem.
Did the tracking quietly break?
This is the most common cause and the least interesting one, which is why it gets skipped.
GA4 events stopped firing after a site release or a Tag Manager edit. A renamed button class is enough to kill a click trigger.
Consent mode changed. With basic consent mode, tags stay blocked until the visitor chooses, so nothing reaches Google in the meantime. Advanced mode sends cookieless pings while consent is denied, which lets GA4 model the key events it could not observe. Modelled numbers are estimates, not counts.
Cross-domain or checkout tracking broke after a platform or payment update.
A thank-you page moved, or a redirect now skips the page where the event fires.
A quick way to see what actually fired, if your site uses Google Tag Manager:
// Submit a test form, then paste this into the browser console on the thank-you page.
// If your conversion event is not in the list, the tag never fired.
window.dataLayer?.filter((entry) => entry.event).map((entry) => entry.event);
For a fuller picture, GA4's DebugView shows events arriving in real time.
If any of this is broken, stop there. Fix the measurement, wait a week, then look again. Testing copy while a tag is broken wastes a month.
Is the process failing even though visitors try?
This is worse than a tracking gap, because the visitor wanted to convert and you lost them.
Baymard Institute's checkout research shows how much of this is technical rather than persuasive. Leaving aside shoppers who were just browsing, these are the most common reasons US shoppers gave for abandoning an order:
- Extra costs too high40%
- Delivery too slow20%
- Did not trust site with card19%
- Forced account creation18%
- Checkout too long17%
- Site errors or crashed17%
- Card declined10%
Source: Baymard Institute, cart abandonment research (excludes 'just browsing')
Two of those, site errors and declined cards, are process failures you can find by testing. So test your own journey:
Submit your own form and confirm it reaches a person, not an unread inbox.
Buy your own product, including with a card that should be declined.
Check payment decline and fraud rule changes with your gateway.
Confirm booking and confirmation emails actually send.
Baymard also estimates that the average documented cart abandonment rate is 70.22%, and that better checkout design alone could recover $260 billion in lost orders across the US and EU.
Has the traffic changed underneath you?
Same volume, different people. Check:
Query intent mix, especially informational queries displacing commercial ones
Device, country, and new versus returning split
Branded versus non-branded share
Bot and spam sessions
One caution: a rise in Direct traffic is not evidence of anything specific. Some AI assistant referrals arrive without a referrer and land in Direct, but so do bookmarks, typed URLs, stripped parameters, redirects and privacy tools.
Did something change outside the website?
Pricing. Shipping costs. Stock. A discount that ended. A competitor's new offer. A policy change. Seasonality.
None of these touch your pages, and all of them move conversion rate. Ask the commercial team what changed before commissioning a redesign.
Is it a search visibility problem in disguise?
A stable average can hide a collapse inside one segment: one device, one country, branded search, or a single high value page. If rankings, impressions or CTR moved there, that is a separate diagnosis, and it can run alongside everything above. Our guide to pages that are indexed but not ranking covers that side.
So when is it actually the page?
Once the checks above come back clean, look for:
Intent mismatch: the page attracts a question it does not answer near the top.
Competing calls to action, or none that stands out.
Trust gaps at the decision point: no proof, unclear pricing, no credentials.
Form friction: more fields than the visitor has reason to fill in yet.
Numbers tell you where people leave. Session recordings and short user interviews tell you why.
How do you decide what to test first?
Score each idea from 1 to 10 on impact, confidence and ease, then rank by the total. Confidence means evidence, not enthusiasm.
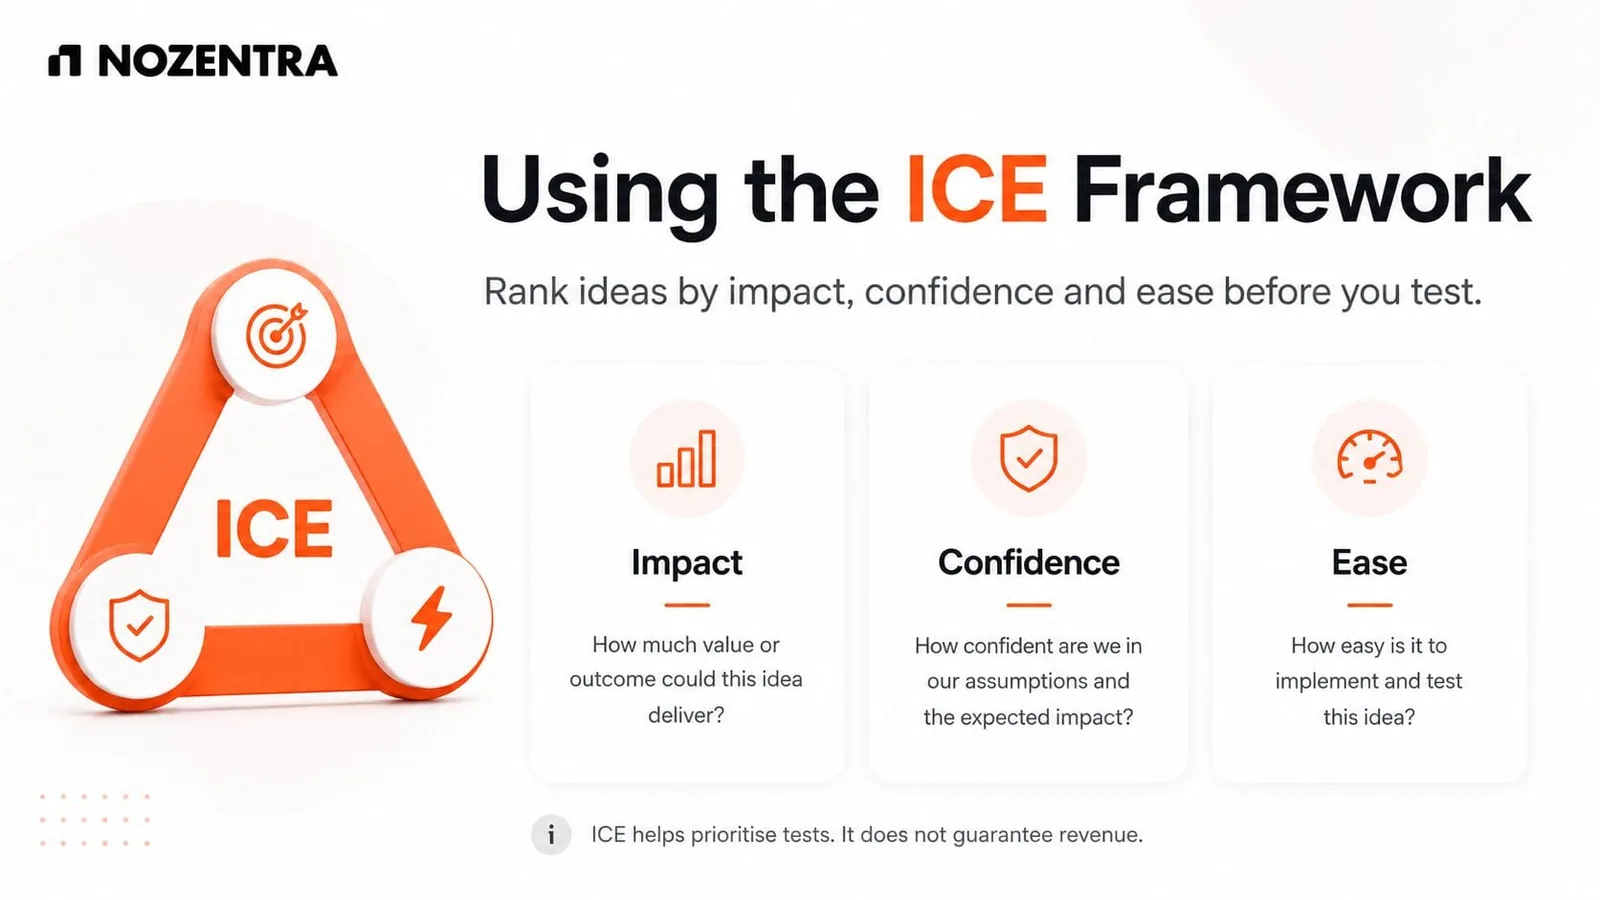
| Idea (illustrative) | Impact | Confidence | Ease | Total |
|---|---|---|---|---|
| Show total cost before checkout | 8 | 8 | 6 | 22 |
| Remove two optional form fields | 5 | 7 | 9 | 21 |
| Redesign the hero section | 6 | 3 | 3 | 12 |
Then check whether the test can even produce an answer. This is how many visitors each variant needs at 95% confidence and 80% power:
| Baseline conversion rate | To detect a 10% lift | To detect a 20% lift | To detect a 30% lift |
|---|---|---|---|
| 1% | 163,095 | 42,693 | 19,827 |
| 3% | 53,211 | 13,914 | 6,455 |
| 5% | 31,234 | 8,158 | 3,780 |
A page with 2,000 visitors a month and a 3% baseline cannot confirm a 20% improvement in any reasonable timeframe. Ship obvious fixes instead, and save formal tests for pages with the traffic to support them.
What should you do next?
Run tracking, process, traffic and offer checks in parallel, because more than one is usually true at once. Treat search visibility as its own investigation. Only then size page tests against real traffic.
If you would rather not work through it alone, tell us what dropped and when and we will run the diagnostic with you. You can also see how our CRO and analytics work is structured.
Frequently asked questions
How is this different from a full CRO audit?
This is the diagnostic step before one. A full audit adds session recordings, user research and A/B testing where the traffic supports it.
How long should a test run before I trust the result?
Until each variant reaches the sample size its baseline rate requires, and for at least one full business cycle, usually a week or two. Use your own baseline in a sample size calculator rather than a fixed rule like "two weeks".
Can conversion rate fall while the business is doing fine?
Yes. If revenue per visitor, average order value or lead quality rise at the same time, a lower rate can sit alongside better results. Check a value based metric before treating the drop as bad news.
Sources
Google Analytics Help: Consent mode on websites and mobile apps
Sample sizes: two-proportion test, 95% confidence (two-sided), 80% power, calculated by Nozentra